Solar panel array at the Kortright Centre research site

Kortright Research Site

BIPV/T Solar Air Collector – Capstone Project

Building‑Integrated Photovoltaic/Thermal system designed and evaluated through simulation and on‑site context at the Kortright Centre for Conservation.

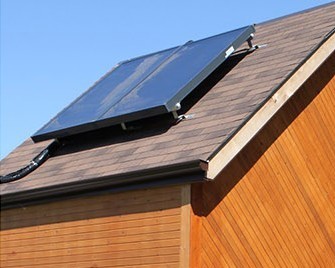
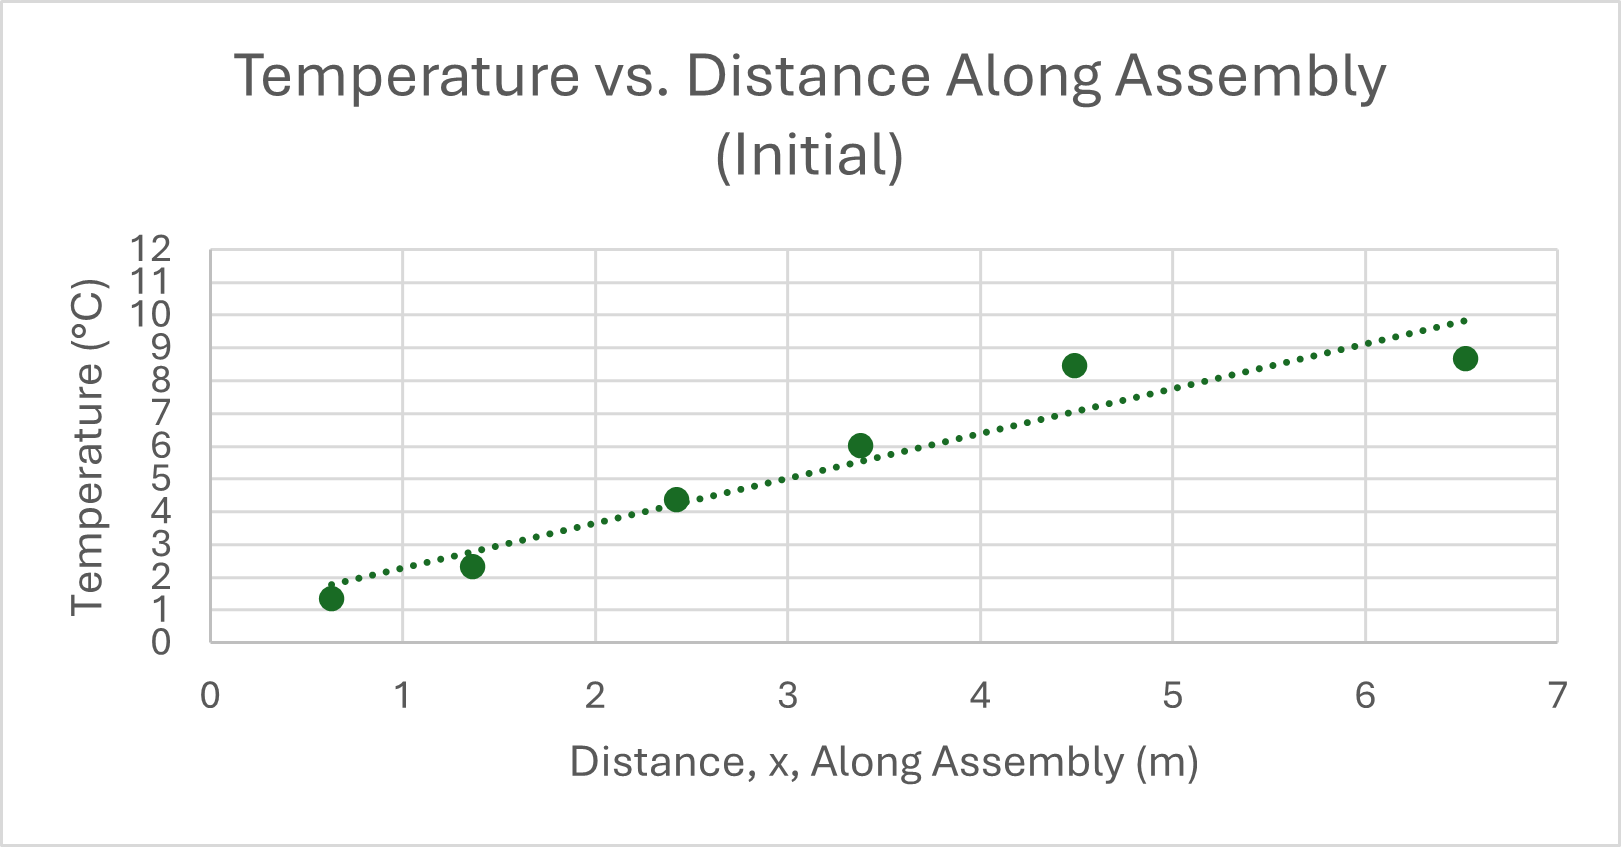
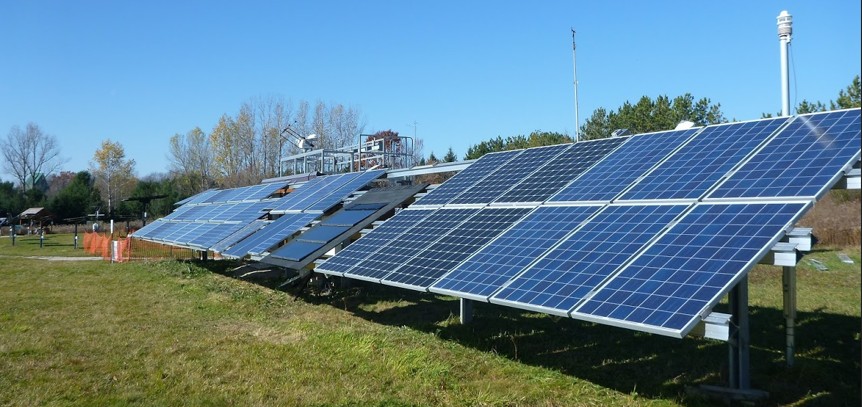
This capstone project focused on designing and optimizing a building‑integrated photovoltaic/thermal (BIPV/T) solar air collector for residential heating. Unlike purely theoretical projects, this work was grounded in a real research site, informed by an on‑site visit and an existing PV installation at the Kortright Centre for Conservation.

Kortright conducts applied research and demonstration projects to evaluate practical, low‑carbon building technologies in real‑world conditions. Visit Kortright Centre and learn more here.

Kortright Centre for Conservation research site
Kortright Research BIPV/T Prototype

Problem Context

Residential heating in Ontario has historically relied on natural gas due to low fuel costs. Rising energy prices and climate targets are motivating low‑carbon heating solutions that can integrate with existing building infrastructure.

Conventional photovoltaic (PV) panels convert only a fraction of incident solar energy into electricity; the remainder is lost as heat. Elevated panel temperatures reduce electrical efficiency and contribute to long‑term material degradation.

Conventional PV thermal loss diagram
Conventional PV thermal loss
BIPV/T thermal recovery diagram
BIPV/T thermal recovery

System Description

The BIPV/T system consists of PV panels mounted above a sealed air channel. Outdoor air is drawn through the channel, absorbing heat from the underside of the panels before exiting as warmed air.

  • Air channel beneath PV panels
  • Fan to ensure consistent airflow
  • Passive enhancement features to promote turbulence
  • Inlet and outlet designed for uniform flow distribution

Design Concepts Explored

Multiple airflow enhancement concepts were developed and evaluated to improve convective heat transfer while maintaining feasibility for residential implementation.

Note: Thermal simulation illustrate air temperature distribution within the duct, where blue indicates cooler regions and yellow–red indicates warmer regions. More uniform warm colours indicate improved heat transfer.

Baseline BIPV/T airflow simulation showing limited heat transfer
Simple Air Channel: Baseline configuration with minimal airflow guidance, resulting in cooler regions and non-uniform heat extraction.No internal enhancements; used as a reference case.
Simulation showing improved airflow with guiding walls
Guiding Walls Concept: Guiding walls reduce cool zones and enhance heat recovery along the duct. Guiding wall concept promoting better airflow distribution and increased heat transfer along the duct. Example of concept (left), position of fan inlet to side of system (left) vs bottom of system (right).
Simulation showing improved airflow with fins enhancements
Fins Enhancement Concept: Fin enhancement increasing surface interaction and promoting warmer, more uniform temperature distribution. Example of concept (left), position of fan inlet to side of system (center) vs bottom of system (right).
Thermal simulation of porous mesh airflow enhancement
Porous Mesh Concept: Porous metal mesh promotes turbulent airflow, increasing heat transfer from the panel surface. Improved thermal recovery at the cost of increased flow resistance. Porous materials introduce additional flow resistance and were evaluated for performance vs pressure drop trade-offs. Promoted turbulence and mixing with modest pressure impact. Example of concept (left), position of fan inlet to side of system (left) vs bottom of system (right).

Key Results

The original baseline design had only two temperature sensors at the inlet and outlet, so performance data along the duct was not available. Subsequent iterations included distributed sensor measurements to quantify the effect of passive design enhancements.


Reynolds number along duct length
Figure A: Initial Concept – Reynolds number along duct length
Temperature distribution along duct length
Figure C: Initial Concept – Temperature distribution along duct